- Location: Mourne Mountains of County Down, south-eastern Northern Ireland
- Type: River
- Catchment area: 216 ha
- Annual rainfall: c. 1800 mm
- Sampling location altitude: 140 m
- Maximum altitude: 700 m
The Bencrom River lies in the Mourne Mountains of County Down, south-eastern Northern Ireland. The catchment area is 216 ha and rises from 140 m where the river meets the Silent Valley Reservoir to a maximum of 700 m at Slieve Meelbeg. The underlying geology is fine-grained granite with localised superficial boulder clay drift. Soils are dominated by blanket peats which are eroding in the upper part of the catchment. Moorland species characterised by Calluna, Molinia, and Sphagnum mosses, comprise the catchment vegetation, with Pteridium in the lower reaches indicating land-use disturbance in the past. Contemporary land-use and management is confined to low-intensity sheep grazing and infrequent heather burning.
The site lies within the Eastern Mournes Area of Special Scientific Interest and Special Area of Conservation, as well as the Mourne Area of Outstanding Natural Beauty.
The annual rainfall is c. 1800 mm.
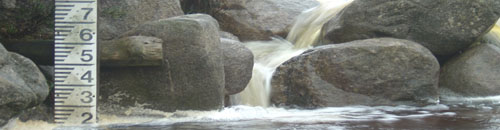
The altitude range is from 140 m at the sampling station to 500 m at the headwaters. The channel section utilised for biological sampling lies immediately upstream of the confluence with the Silent Valley Reservoir and comprises a 4-5 m wide boulder- strewn channel with numerous rapids.
[collapsed title="Water chemistry"]
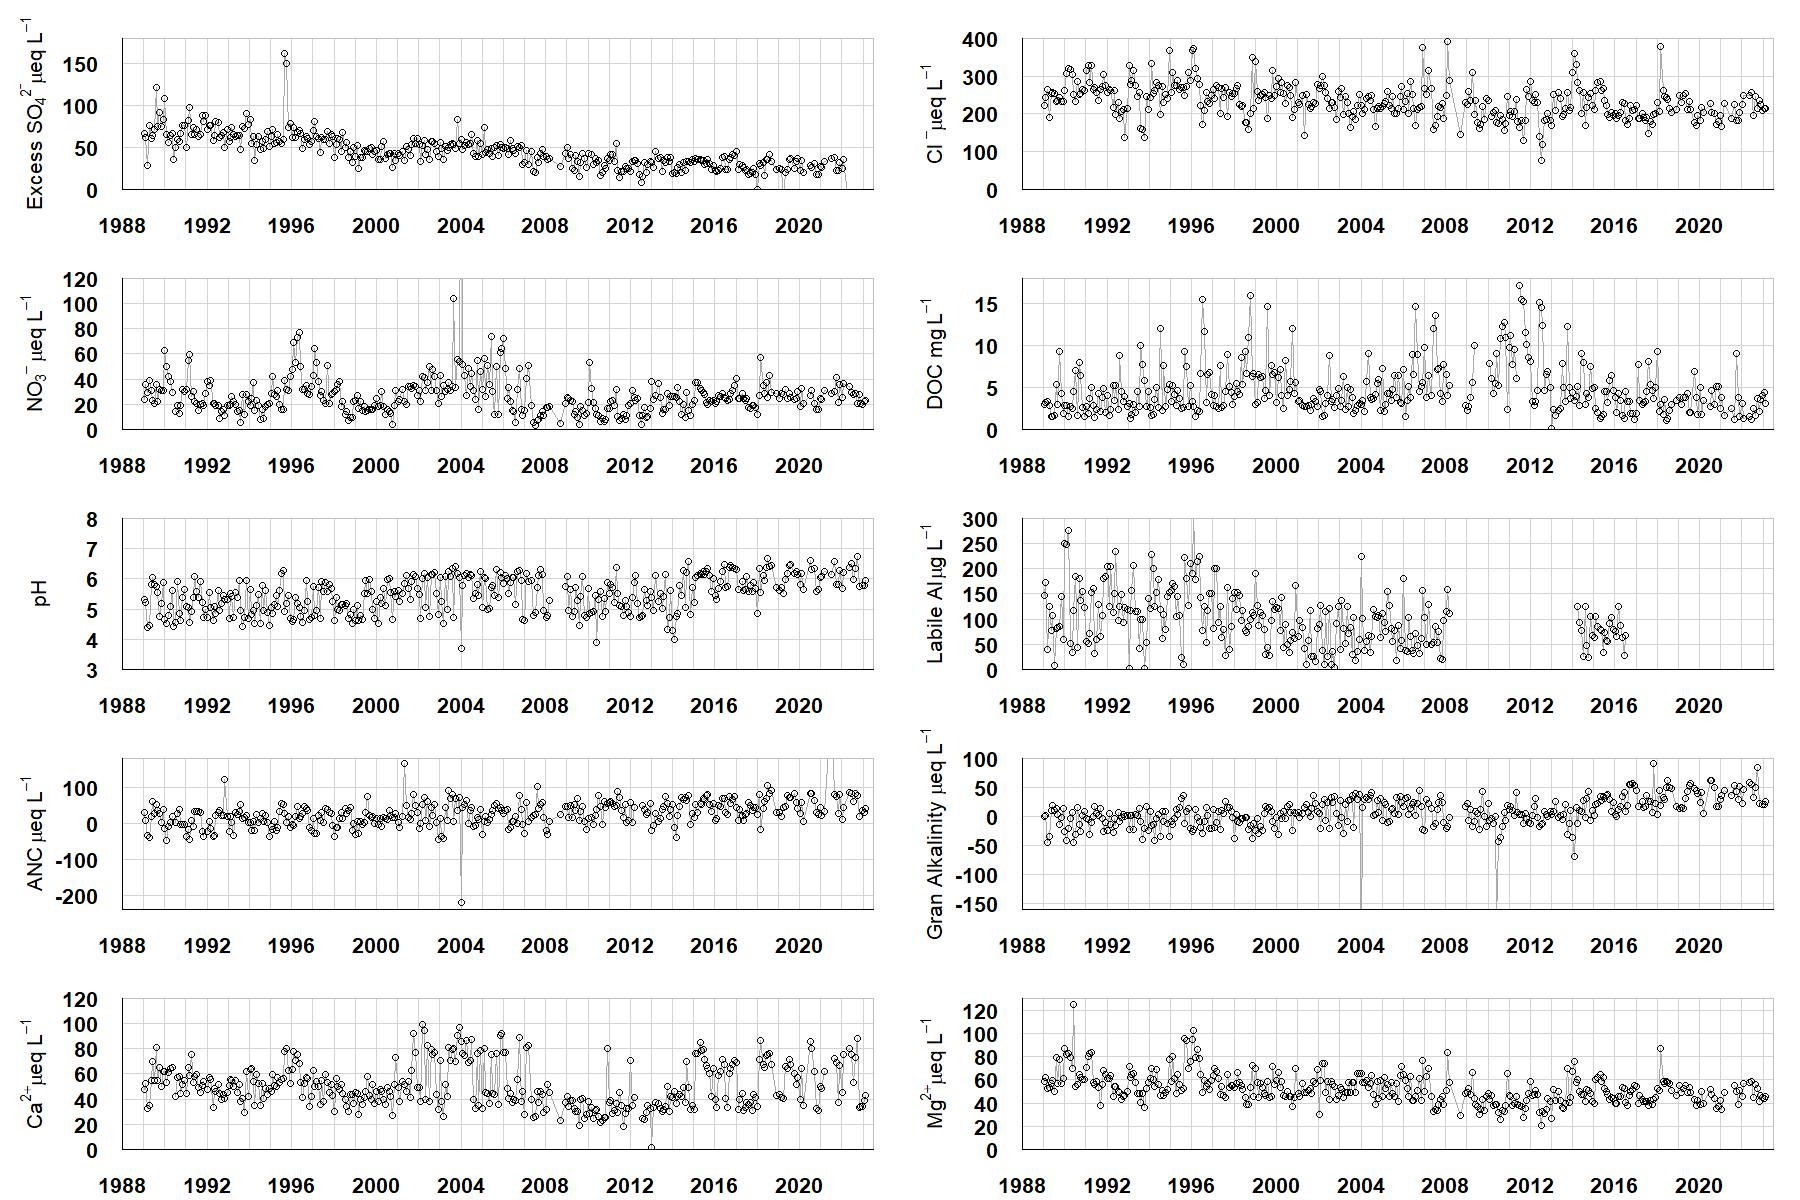
Excess SO42- = all sulphate not derived from marine salts; Cl- = chloride; NO3- = nitrate; DOC = dissolved organic carbon; Labile Al = inorganic monomeric (labile) aluminium; ANC = Acid Neutralising Capacity (determined by the difference (in equivalents) between total base cation concentration and total acid anion concentration); Gran Alkalinity = alkalinity determined by a Gran titration; Ca2+ = calcium; Mg2+ = magnesium.
[/collapse]
[collapsed title="Epilithic diatoms"]

Annual mean percentage abundance of the most common diatom taxa in replicate samples of the biofilm of stone surfaces. Taxa are arranged in the plot so that those that had their highest percentage abundances at the beginning of the monitoring record appear at the top of the figure, and those that have become most common at the end of the record appear at the bottom.
[/collapsed]
[collapsed title=Macroinvertebrates]
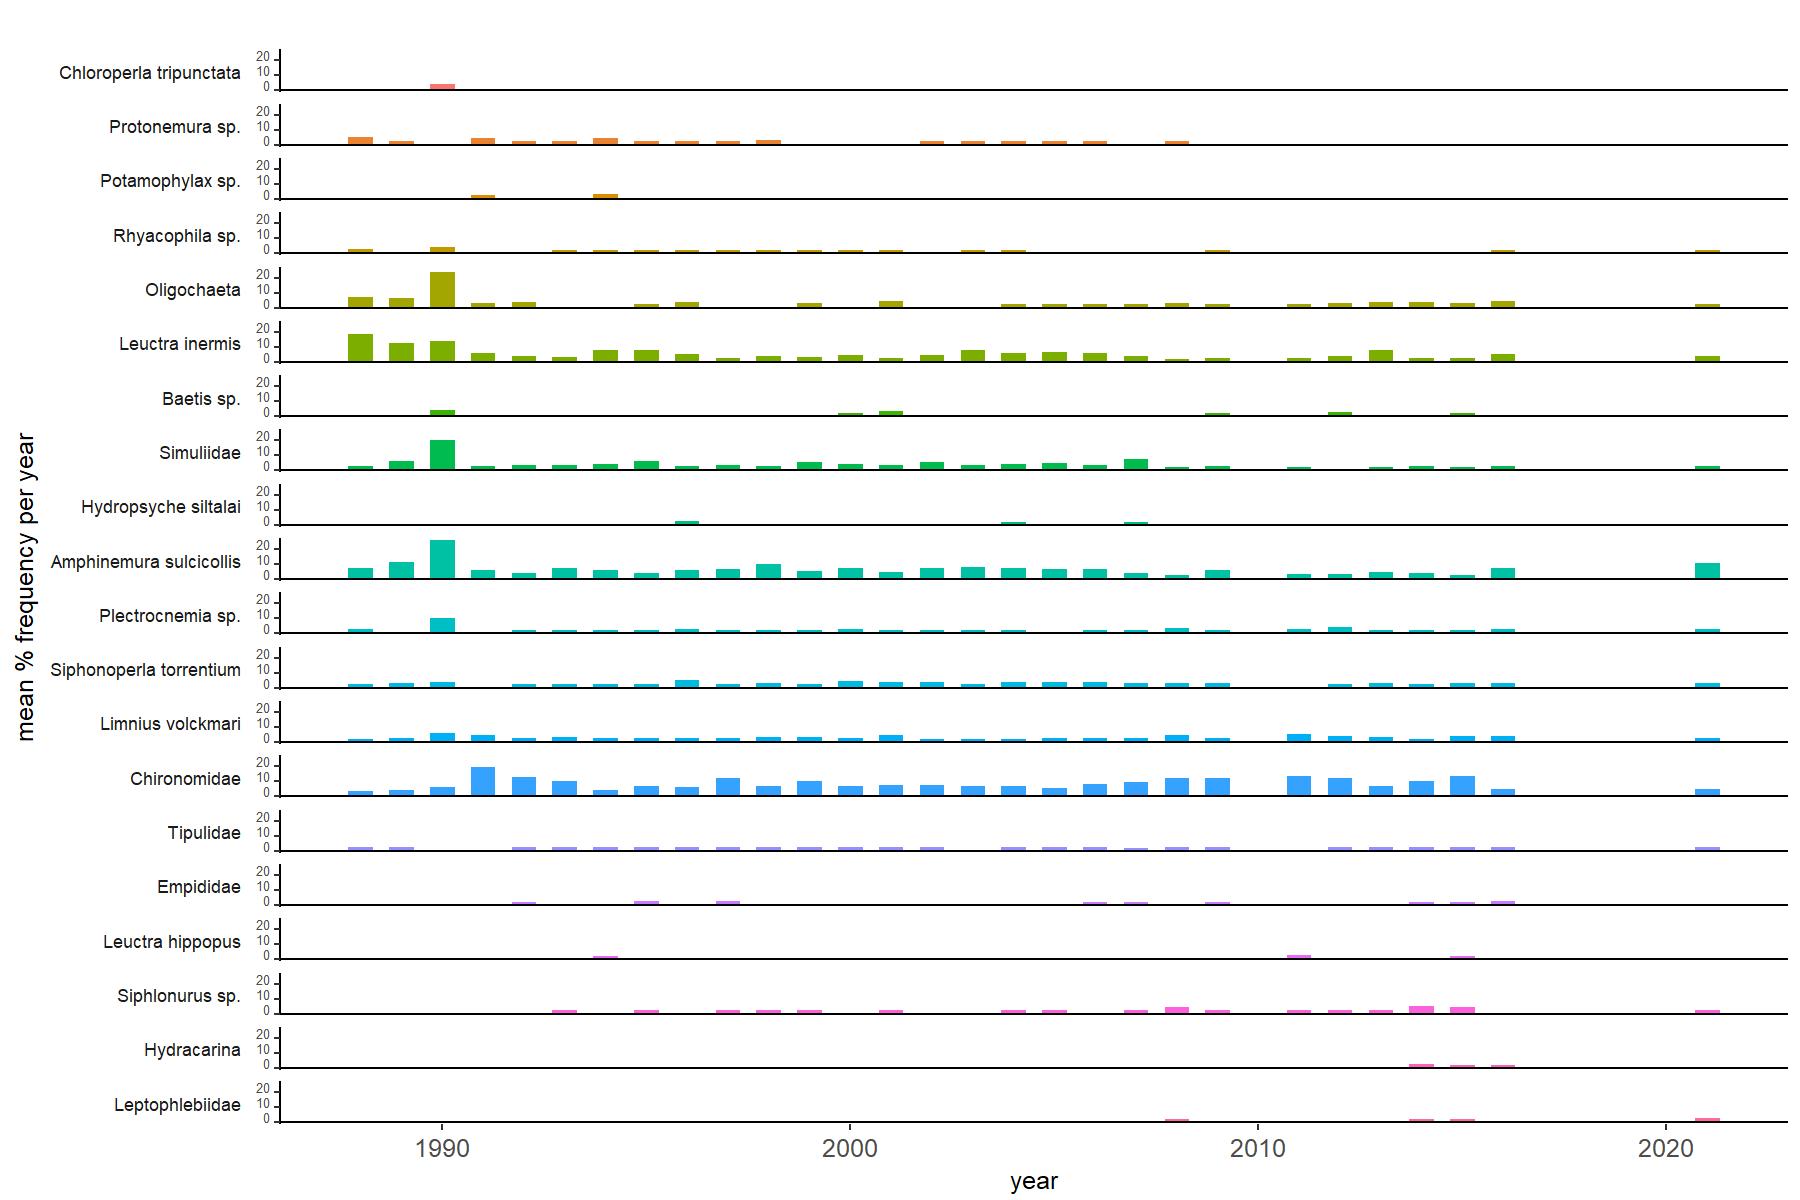
Abundance of the most common macroinvertebrate taxa as a percentage of all individuals collected in five bulked kick samples. Taxa are arranged in the plot so that those with their highest percentage abundances at the beginning of the monitoring record appear at the top of the figure, and those that have become most common at the end of the record appear at the bottom.
[/collapse]
[collapsed title=Bencrom River Bibliography]
[/collapse]